| |||||||||||||||||||||||||||||||||||||||||||||||||||||||||||||||


 Rab GTPase family 3 contains Rab3A, Rab3B, Rab3C and Rab3D. The Rab3 subfamily contains Rab3A, Rab3B, Rab3C, and Rab3D. All four isoforms were found in mouse brain and endocrine tissues, with varying levels of expression. Rab3A, Rab3B, and Rab3C localized to synaptic and secretory vesicles; Rab3D was expressed at high levels only in adipose tissue, exocrine glands, and the endocrine pituitary, where it is localized to cytoplasmic secretory granules. Rab3 appears to control Ca2+-regulated exocytosis. The appropriate GDP/GTP exchange cycle of Rab3A is required for Ca2+-regulated exocytosis to occur, and interaction of the GTP-bound form of Rab3A with effector molecule(s) is widely believed to be essential for this process. Functionally, most studies point toward a role for Rab3 in the secretion of hormones and neurotransmitters. GTPase activating proteins (GAPs) interact with GTP-bound Rab and accelerate the hydrolysis of GTP to GDP. Guanine nucleotide exchange factors (GEFs) interact with GDP-bound Rabs to promote the formation of the GTP-bound state. Rabs are further regulated by guanine nucleotide dissociation inhibitors (GDIs), which facilitate Rab recycling by masking C-terminal lipid binding and promoting cytosolic localization. Most Rab GTPases contain a lipid modification site at the C-terminus, with sequence motifs CC, CXC, or CCX. Lipid binding is essential for membrane attachment, a key feature of most Rab proteins. Due to the presence of truncated sequences in this CD, the lipid modification site is not available for annotation.
 No pairwise interactions are available for this conserved domain.


Tips:  Range on the Protein: Protein ID Protein Position Domain Position: 

|
|---|


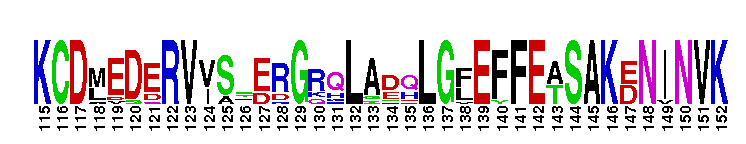
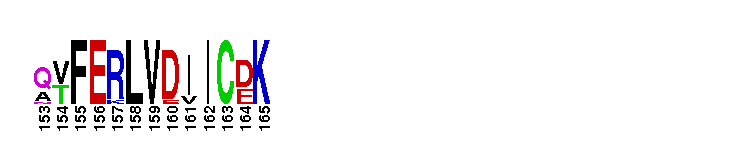
Weblogos are Copyright (c) 2002 Regents of the University of California
| DMDM_info@umbc.edu | 1000 Hilltop Circle, Baltimore, MD 21250 | Department of Biological Sciences | Phone: 410-455-2258 |